
PJM Hourly Demand + Population-Weighted Weather
- rows
- over 96,000
- 2015 to 2026
- 11 yrs
- columns
- 44
- baseline MAPE
- 3.42%
Demand for the largest US grid joined to ERA5 weather, population weighted across ten metros and UTC aligned across every daylight saving transition, on the same schema as the ERCOT and CAISO datasets. Every imputed, interpolated, or preliminary value is flagged in the data. A LightGBM baseline reaches 3.42% MAPE against an 8.78% seasonal naive benchmark, trained through 2024-12-31 and tested from 2025-01-01 onward, roughly 18 months.
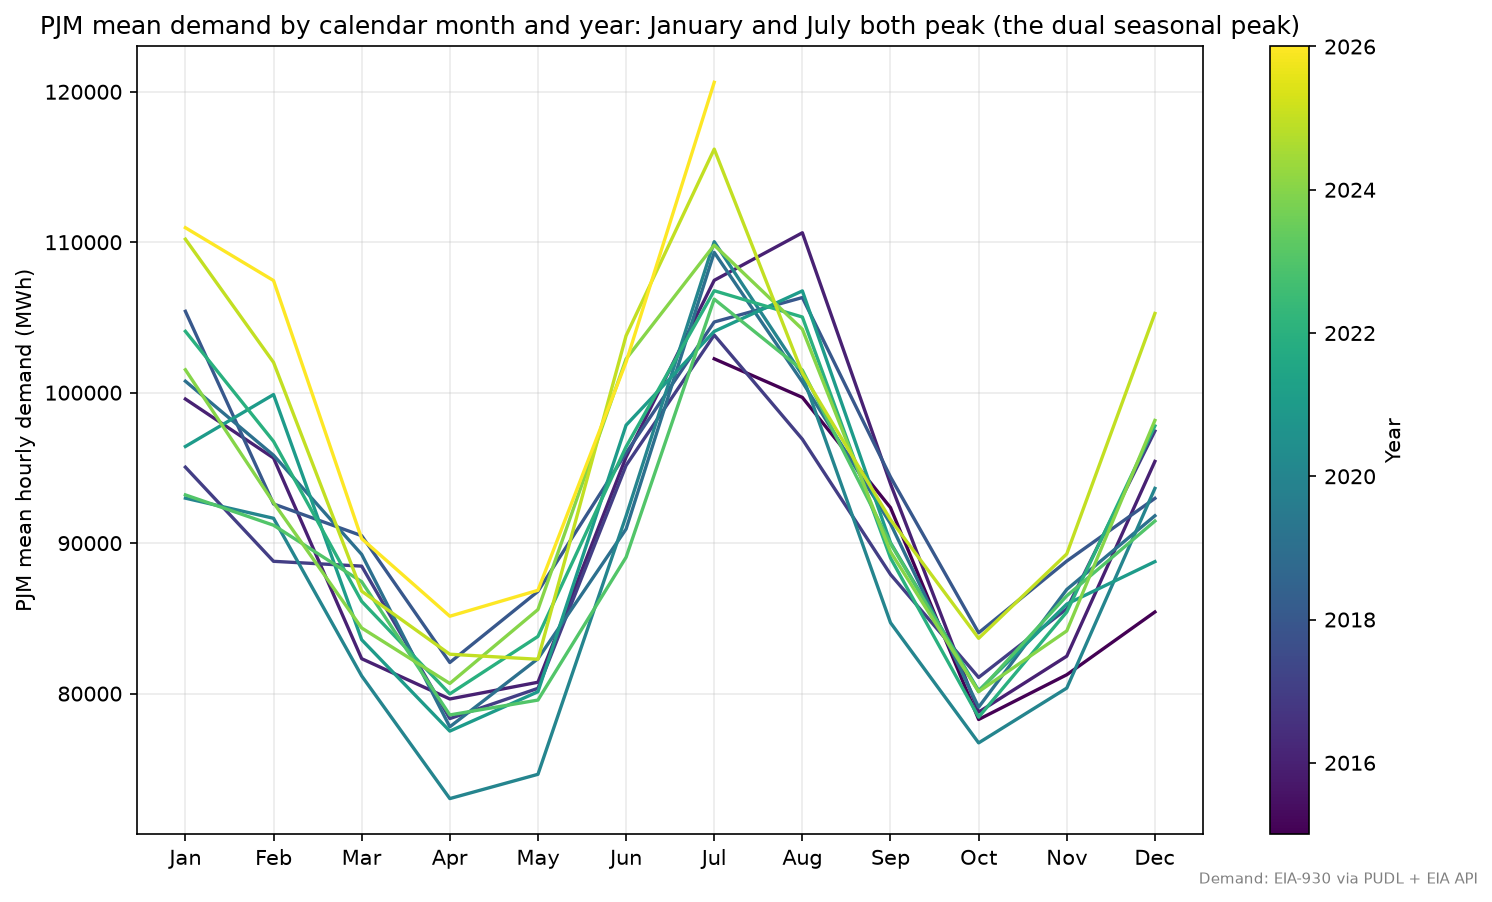
The signature
PJM is the most dual peaked grid in this series. January runs 1.17 to 1.33 times the shoulder months and July 1.24 to 1.47, because both electric heating and air conditioning bind across a 13 state footprint. The year gradient shows the newest story: data center growth is pushing demand toward all time records, with mean July demand up about 10 percent from 2024 to 2026. Weather explains the swings; that trend is load growth, and the dataset says so plainly.
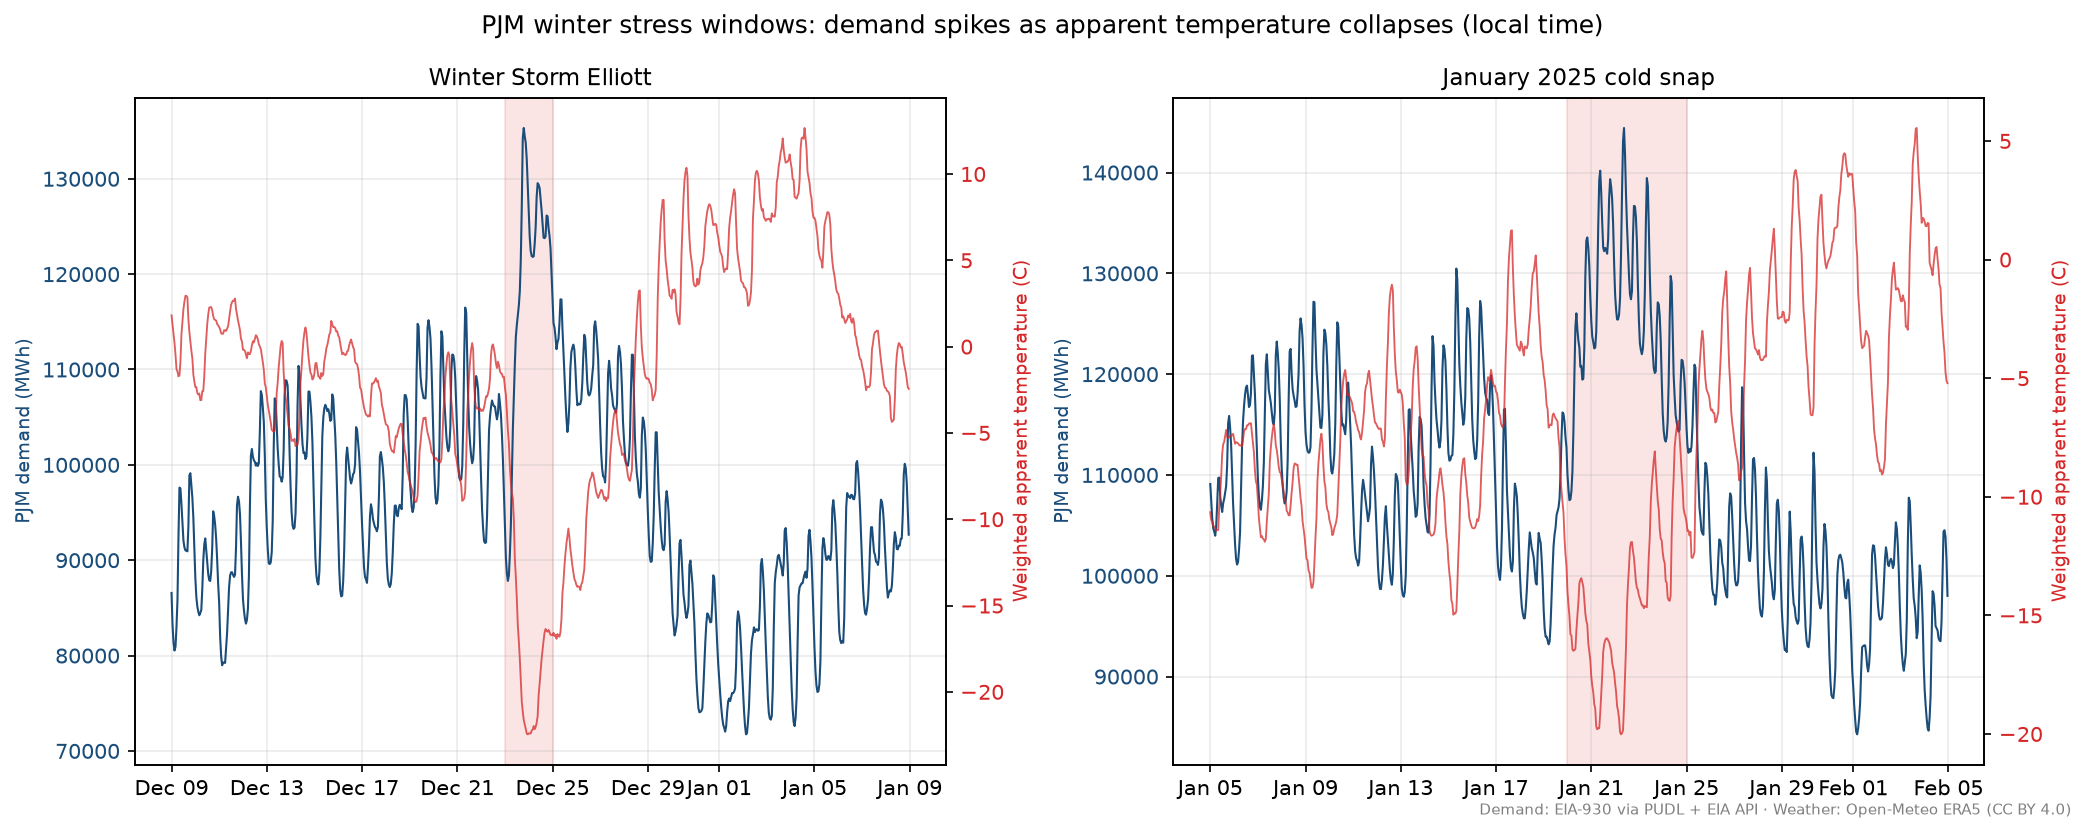
Winter is when the system is stressed hardest. Winter Storm Elliott in December 2022 and the January 2025 cold snap are both inside the data range, and both stand visibly above their adjacent weeks while the weighted apparent temperature collapses to -22.5 C and -20.0 C.
Inside the data
44 columns per UTC hour. Weather is ERA5 at ten points, Chicago, Newark, Washington DC, Philadelphia, Baltimore, Pittsburgh, Cincinnati, Cleveland, Columbus, and Norfolk, weighted by Census Vintage 2025 populations. Ten points because PJM spans continental Midwest, Appalachian, Mid Atlantic coastal, and Southeast coastal climates; together they cover roughly two thirds of the served population.
The winter columns are the PJM additions to the shared schema. Population weighted apparent temperature is a small but robust gain in the baseline ablation, about 0.06 MAPE points: wind chill genuinely drives heating load beyond what dry bulb temperature shows. Hourly snowfall carries no accuracy claim; it ships for storm window and peak risk marking. The solar columns, shortwave radiation and cloud cover, carry the summer side. Calendar features, federal holidays in statutory and observed pairs, degree hours and degree days base 65 F, and quality flags round out the schema.
The weather join is measured, not asserted: in the baseline notebook's ablation on the identical evaluation frame, removing all weather raises the LightGBM error by about 0.8 percentage points. That is the value of actual observed weather; a live deployment running on weather forecasts would see less.
Provenance and limits
The demand series is RTO level total demand for the whole PJM footprint, 13 states plus DC and about 65 million people; a zonal breakdown is not included. The backbone is Catalyst Cooperative's PUDL cleaned EIA-930, topped up with a preliminary tail from the EIA API, flagged by source, with one exception stated plainly: a real API report beats a PUDL placeholder. The weather model is pinned to ERA5, never the archive's default blend, and the trailing week or so that ERA5 has not settled ships with demand kept and weather null, flagged rather than trimmed.
Stated limits: ERA5 is a reanalysis estimate, not station observations, and apparent temperature is one more step derived. Data center growth is a structural trend the weather features do not explain. A backtest on this data uses actual weather, so its error should not be compared head to head with PJM's live day ahead forecast.
Attribution
This dataset is published by Arimancy LLC under CC BY 4.0.
Demand data:Source: U.S. Energy Information Administration (Jul 2026), Form EIA-930 (public domain), cleaned and gap-filled via Catalyst Cooperative's PUDL project (data and documentation CC BY 4.0).
Weather data: Weather data by Open-Meteo.com (CC BY 4.0), ERA5 reanalysis (Hersbach et al. 2023, ECMWF, doi:10.24381/cds.adbb2d47).
Population weights: U.S. Census Bureau CBSA estimates, Vintage 2025 (public domain).