
Observed Weather for Every US Flight, 2019 to 2025
- recent 24 mo rows
- 14M+
- recent 24 mo columns
- 211
- airport weather rows
- 22.2M+
- airport weather columns
- 28
Every US domestic flight from January 2019 to July 2025 joined to the weather actually observed at both the origin and the destination airport at the correct UTC hour. This is a complete historical panel with a fixed end date, not a live feed: the window closes at July 2025 because NOAA stopped ingesting global hourly data on August 27, 2025. The flagship flights table carries 42.8M+ flight rows, partitioned by year; a recent 24 month table and an hourly airport weather table ship alongside it.
Why observed weather
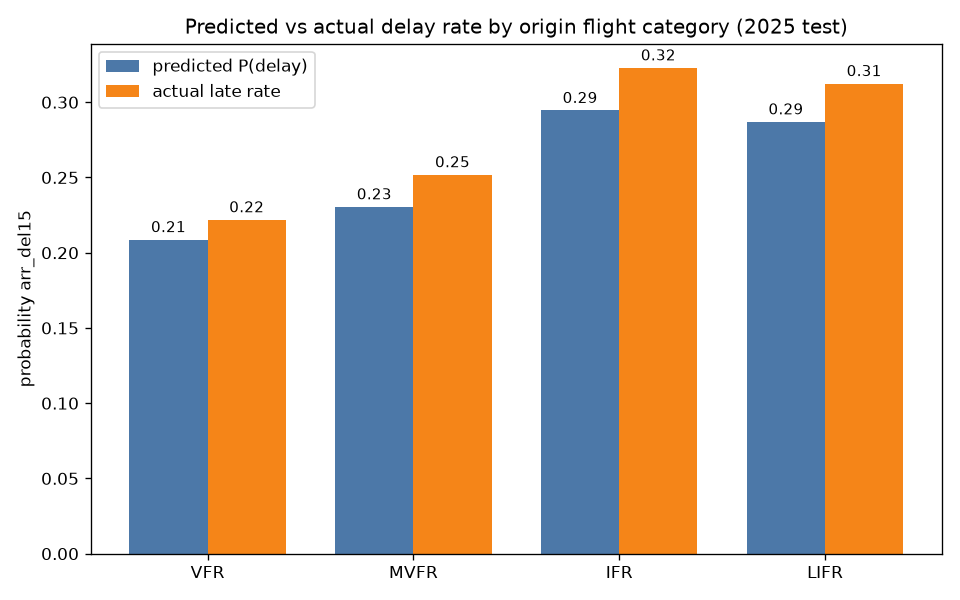
The airline reported weather delay column is unreliable: a DOT Office of Inspector General audit in October 2024 found BTS cannot verify carrier reporting, and among flights arriving 30 or more minutes late out of IFR or LIFR conditions at the origin, only 17 percent report any carrier weather delay at all. The observed conditions tell the real story. Mean arrival delay climbs from 4.26 minutes under clear VFR conditions to 16.28 minutes under LIFR, and cancellations rise from 1.9 to 5.7 percent. This dataset ships the carrier reported columns labeled as what they are, and the measured weather as the intended signal.
Leakage safety as a schema contract
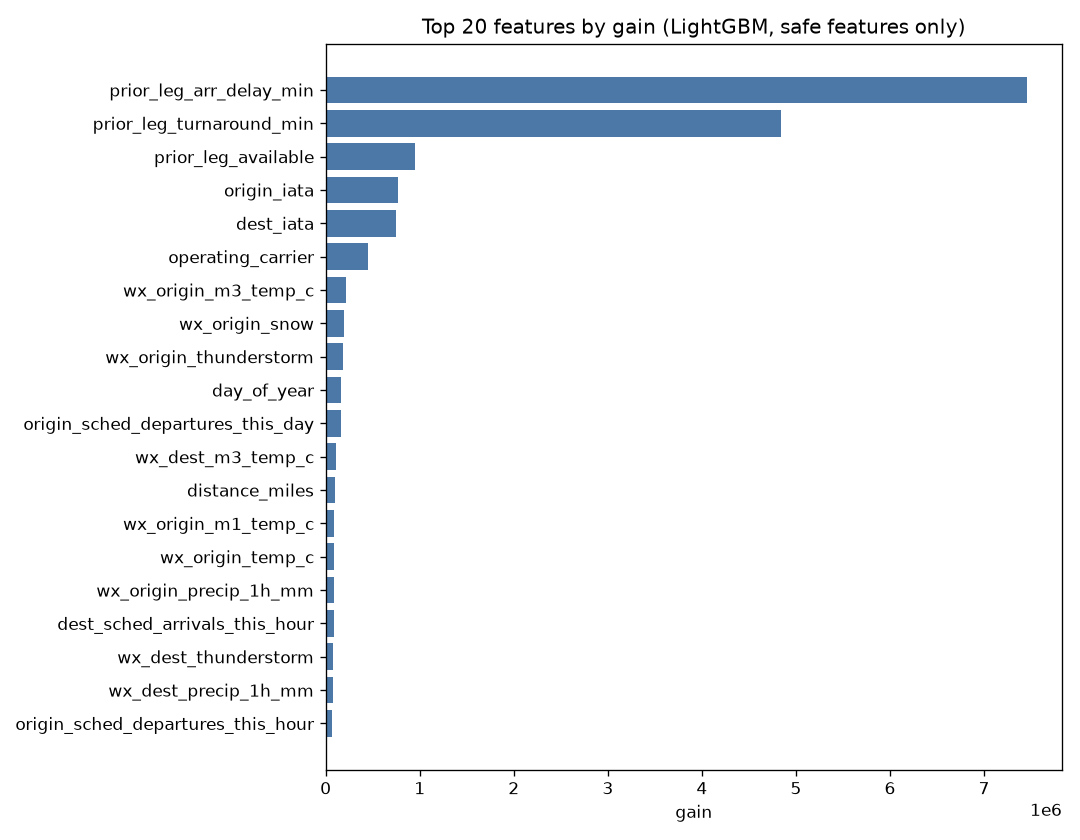
Weather columns come in two families with different rules. The wx_ columns are observed at or before each flight's information cutoff and are safe for prediction. The oracle_ columns are event hour weather, labeled as leaking by default, for retrospective analysis only. A shipped select_safe_features() helper drops every oracle_ column mechanically, keeping 120 of the 211 columns, and the rules are enforced by tests on the full table. A baseline LightGBM model using only safe features lands in the published pre departure performance band, with the gated prior leg signal dominant and observed weather additive.
Inside the data
Four tables ship together. The flagship joins every operated flight to weather at both airports, with core variables, visibility, ceiling, present weather booleans, aviation flight categories from VFR to LIFR, calendar and holiday features, scheduled congestion counts, and gated prior leg features. The recent 24 month table carries the same schema in a single file for lighter weight work. The airport hourly weather table stands on its own: station hours on a complete UTC grid with missing hours flagged, never imputed. An airports reference table documents the airport to weather station crosswalk, 386 airports with a median station distance of 0.704 km, each with its match method and quality flags.
Limits, documented
The fixed end date is a source condition, not a limit of the build: NOAA ISD stopped ingesting global hourly data on August 27, 2025, and the dataset ends at the last complete weather month so no shipped flight has null weather. If that ingest resumes, or an equivalent observed station source is adopted, the panel extends from where it ends. Coverage is BTS reporting carriers, US domestic flights only. 2020 is a COVID regime break, documented rather than smoothed. Weather comes from the nearest NOAA station, almost always the airport's own, and nothing is imputed anywhere in the panel.
Attribution
This dataset is published by Arimancy LLC under CC BY 4.0.
Flight data: Source: Bureau of Transportation Statistics, On-Time Performance data, a US Government work in the public domain.
Weather data: Source: NOAA Integrated Surface Database observations, a US Government work in the public domain.
Airport coordinates: OurAirports.
BTS and NOAA do not endorse Arimancy or this dataset, and any errors introduced in cleaning or joining are Arimancy's alone.