
CAISO Hourly Demand + Population-Weighted Weather
- rows
- over 96,000
- 2015 to 2026
- 11 yrs
- columns
- 35
- baseline MAPE
- 2.71%
California grid demand joined to population weighted ERA5 weather, UTC aligned across every daylight saving transition, on the same schema as the ERCOT and PJM datasets. Every imputed or preliminary value is flagged in the data, not buried in a footnote. A LightGBM baseline reaches 2.71% MAPE against a 6.04% seasonal naive benchmark, trained through 2024-12-31 and tested from 2025-01-01 onward, roughly 18 months.
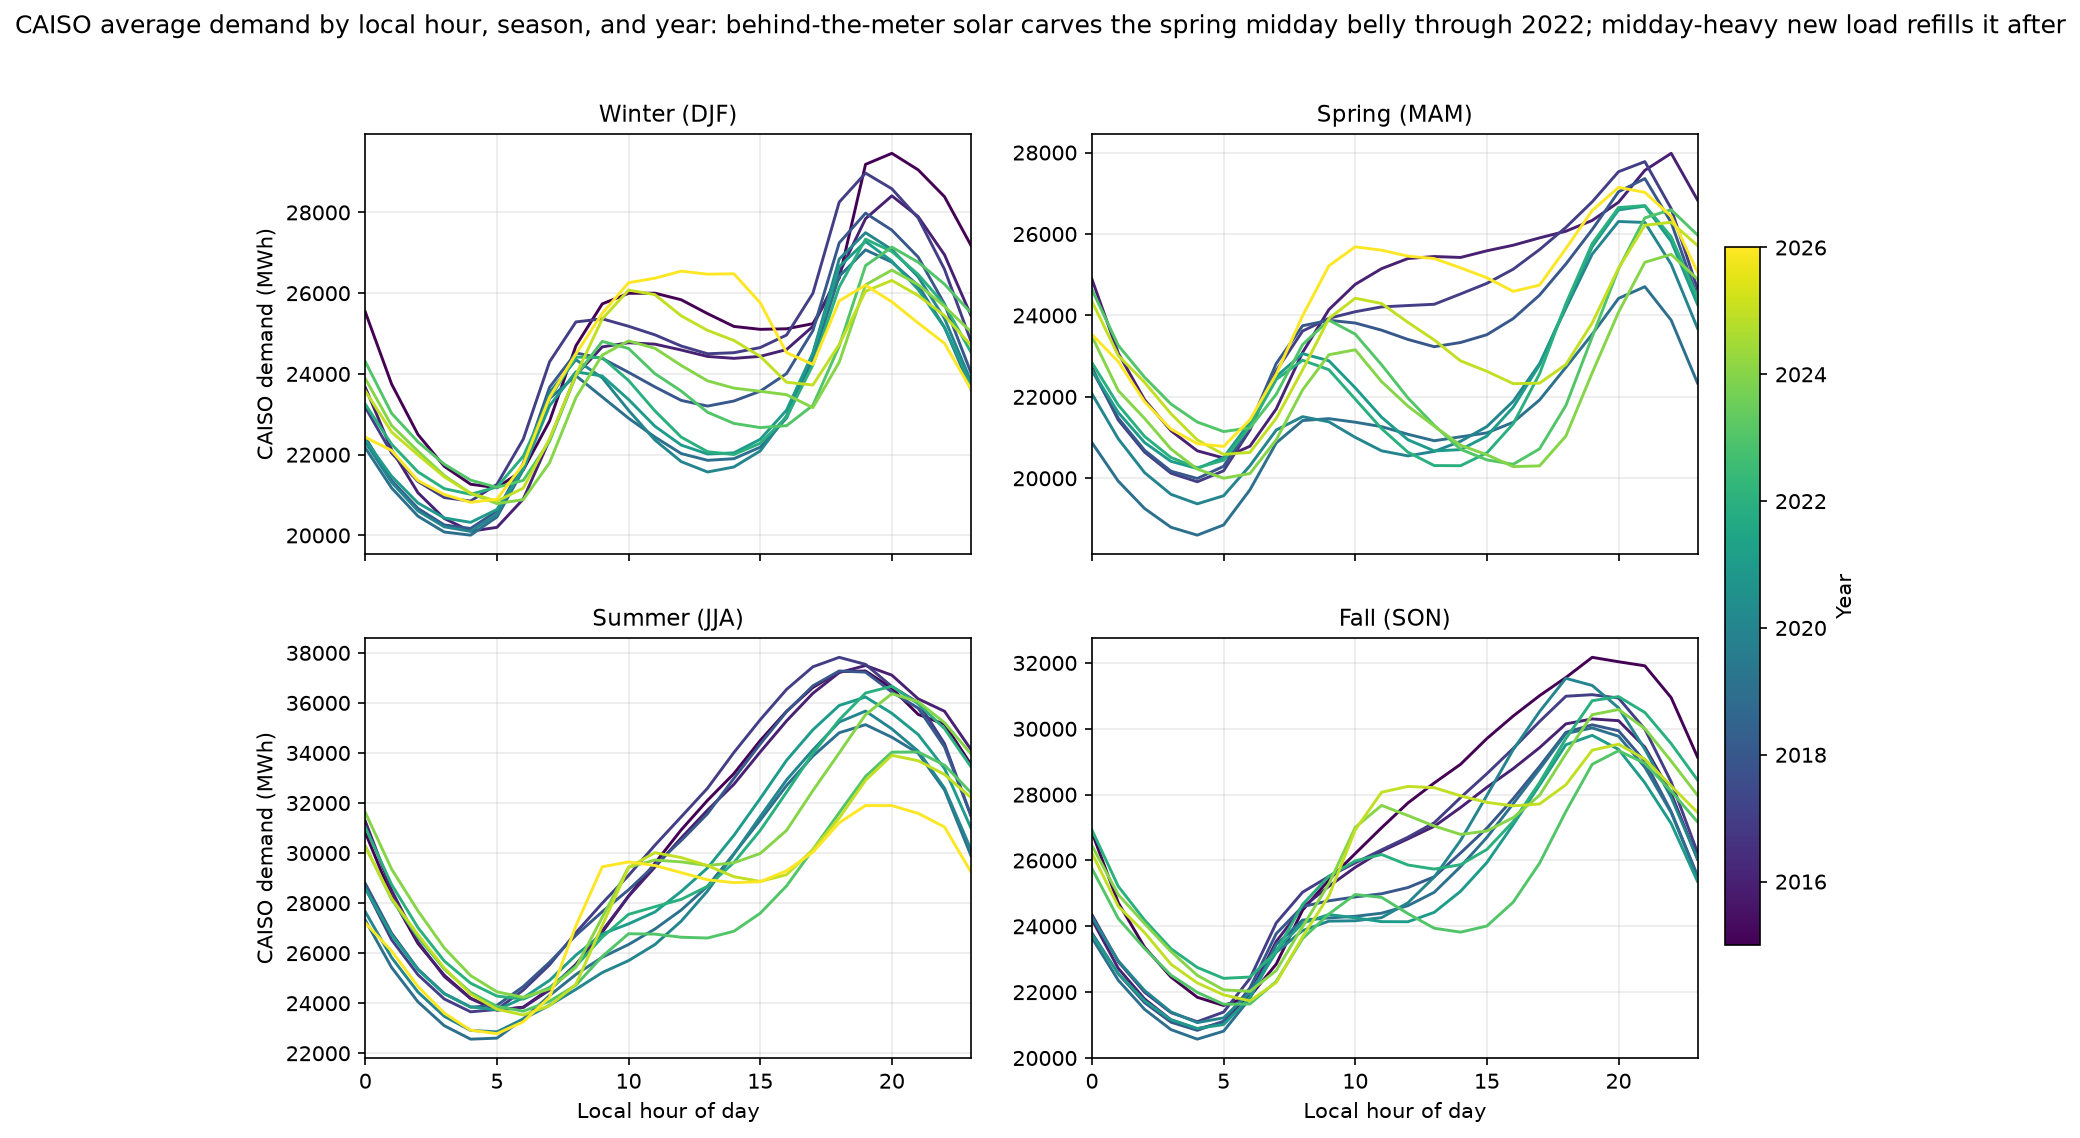
The signature
The seasonal chart is the dataset's story. Spring midday demand sinks deeper each year from 2016 through 2022 as behind the meter rooftop solar grows, bottoming out at 0.844 of the morning and evening shoulders in spring 2022. From 2023 the belly refills, reaching 1.014 of the shoulders by 2026, while overnight demand barely moves. To be precise: this is metered demand, not net load. The famous duck curve is net load, which this dataset does not contain. What you see is the behind the meter solar effect visible in demand, and its partial reversal.
The solar columns serve that story: population weighted shortwave radiation and cloud cover, weighted with the identical code as temperature. In the baseline notebook's staged ablation they add about 0.03 MAPE points on top of calendar, demand history, and temperature features. They exist for solar generation and price work, not to flatter the demand baseline.
Inside the data
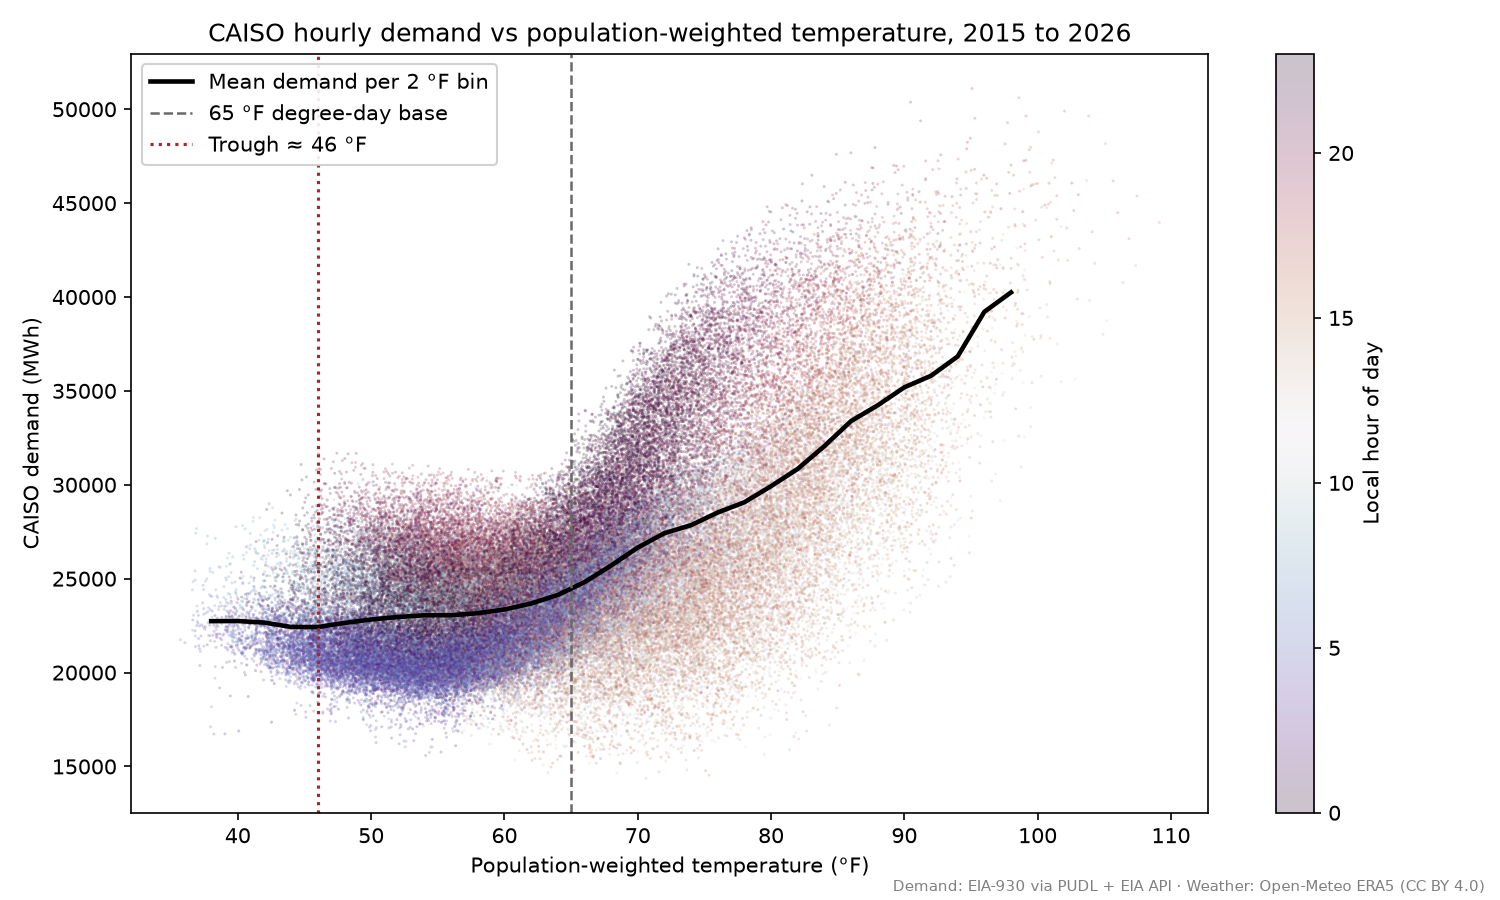
35 columns per UTC hour. Demand ships with its provenance: the canonical MWh value, the as reported value, the PUDL imputed value with its reason code, and a demand_source column separating cleaned history from the preliminary tail. Weather is ERA5 at seven California points, Los Angeles, Riverside, San Diego, San Francisco, San Jose, Sacramento, and Fresno, weighted by Census Vintage 2025 populations. The Bay is deliberately split into coastal San Francisco and inland San Jose, and Riverside carries the Inland Empire cooling load, because California microclimates drive the demand response.
Calendar features come from local wall clock time. Holidays ship in statutory and observed pairs for both the US federal and the California calendar. Degree hours and degree days use the standard base 65 F. Quality flags mark imputed demand, missing or interpolated weather, DST transition days, and the preliminary ERA5T window.
Provenance and limits
The demand backbone is Catalyst Cooperative's PUDL cleaned EIA-930; the freshest roughly 2 months come straight from the EIA API and are flagged preliminary and unimputed. Only interior weather gaps of 3 hours or less are interpolated, and flagged. The weather model is pinned to ERA5, never the archive's default blend, and the most recent roughly 3 months are ERA5T preliminary values that ECMWF may still revise, flagged so you can filter them.
Stated limits: CAISO is roughly 80 percent of California load, and municipal utilities such as LADWP and SMUD are separate balancing authorities outside this series. ERA5 is a reanalysis estimate, not station observations. A backtest on this data uses actual weather, so its error should not be compared head to head with CAISO's live day ahead forecast, which runs on weather forecasts and analyst correction.
Attribution
This dataset is published by Arimancy LLC under CC BY 4.0.
Demand data:Source: U.S. Energy Information Administration (Jul 2026), Form EIA-930 (public domain), cleaned and gap-filled via Catalyst Cooperative's PUDL project (data and documentation CC BY 4.0).
Weather data: Weather data by Open-Meteo.com (CC BY 4.0), ERA5 reanalysis (Hersbach et al. 2023, ECMWF, doi:10.24381/cds.adbb2d47).
Population weights: U.S. Census Bureau CBSA estimates, Vintage 2025 (public domain).